Abstrakt
We present a forward-viewing fiber scanning endoscope (FSE) for high-speed volumetric optical coherence tomography (OCT). The reduction in size of the probe was achieved by substituting the focusing optics by an all-fiber-based imaging system which consists of a combination of scanning single-mode fibers, a glass spacer, made from a step-index multi-mode fiber, and a gradient-index fiber. A lateral resolution of 11 μm was achieved at a working distance of 1.2 mm. The newly designed piezo-based FSE has an outer diameter of 1.6 mm and a rigid length of 13.5 mm. By moving the whole imaging optic in spirals for scanning the sample, the beam quality remains constant over the entire field of view with a diameter of 0.8 mm. The scanning frequency was adjusted to 1.22 kHz for use with a 3.28 MHz Fourier domain mode locked OCT system. Densely sampled volumes have been imaged at a rate of 6 volumes per second.
© 2018 Optical Society of America.
The article can be downloaded free of charge as a PDF file at:
[wpResize]
Full Article
© 2018 Optical Society of America under the terms of the OSA Open Access Publishing Agreement
Optical coherence tomography (OCT) is an interference-based imaging technology that provides cross-sectional and volumetric images with a resolution in the micrometer regime[1]. Due to scattering, in most biological tissues the depth of OCT imaging is limited to approximately 1 to 2 mm. Therefore, imaging of the inner organs is only possible by using endoscopic probes[2]. Forward- and side-viewing OCT probes were demonstrated. Side-viewing probes based on rotating fibers were developed by several groups[3,2] and are suited for the imaging of tube-like hollow organs such as the coronary artery or the gastro-intestinal tract. They are now routinely used in the clinics for cardiovascular applications. With modern fiber rotary joints, rotational speeds of 350 rounds per second (rps) were reached[5]. In 2015, Wang et al. presented the first megahertz OCT endoscope, based on a micromotor[6] reaching 3500 rps. Recently, for fast side-viewing volumetric imaging, Liang et al. combined a circle scanning fiber probe with a fast-rotational motor achieving 3 volumes per second (vps)[7]. In addition, side-viewing needle probes with up to 127000 A-scans per second were demonstrated for the imaging of lung tissue[8] or breast tumors[9].
However, there are also locations inside the body which are better imaged by a forward-viewing probe, e.g., branches of the airways and the stomach or the bladder. Forward-viewing probes can be built in different ways. One option is to use micro-electro-mechanical systems, which are considerably larger in diameter or a rigid length[10,11].
Another way to develop advanced point scanning endoscopes is to build them with a piezoelectric tube that excites a single-mode fiber to oscillate in Lissajous curves or spirals. These so-called fiber scanning endoscopes (FSE) have been developed in recent years, in particular, by the groups around Seibel[12] and Li[13]. In front of the scanning fiber, an imaging system, usually consisting of a gradient-index (GRIN) lens, focuses the light into the tissue. For the application in OCT, the first FSE which generated 2D sectional images was presented by Liu et al. in 2004[14]. 3D imaging was first demonstrated in 2010 by Huo et al.[15]. The smallest piezo-based OCT endoscope so far was presented by Vilches et al. with an outer diameter (OD) of 2.5 mm and a rigid length of 15 mm[16]. Lurie et al. have presented an OCT probe based on this principle with the fastest reported volume rate of 12.5 Hz[17]. However, image quality was limited by using a 100 kHz A-scan rate OCT system. Only 8000 A-scans were available for each volume, and the images were massively undersampled. Recently, Liang et al. presented the combination of an FSE with a megahertz A-scan rate OCT system reaching 2 vps[18]. Using a vibrating fiber, in our view, is the most promising way to build compact forward-looking OCT probes. However, limitations in size, volume imaging rate, or sampling density are still present. For imaging organs through small entries or tight corners, small ODs and short rigid lengths are indispensable. A high-volume rate becomes important when the epithelium of the entire organ is to be examined, e.g., in the diagnosis of cancer or the surveillance of bladder carcinoma. Another application would be the quantification of mucus transport disorders due to lung diseases, which is considerably facilitated by 3D imaging. Furthermore, a high imaging speed is crucial to avoid motion artifacts during the acquisition.
This Letter presents a piezo-based FSE using a moving optics concept, which reduces the OD and rigid length and avoids parasitic reflections between the fiber and the focusing lens. An OD below 2 mm allows the use of the working channel in most endoscopes which have diameters of at least 2.4 mm. Combining high volume rates with a high sampling density was possible by using our new FSE with a 3.28 MHz Fourier domain mode-locked (FDML) OCT system[19].
The piezo-based FSE is shown in Fig. 1. It consists of a piezo tube with four radially attached electrodes which excite bending oscillations of the fiber cantilever with the all-fiber-based optic in the corresponding two orthogonal directions. This is housed inside a stainless steel tube with an inner diameter of 1.4 mm, a wall thickness of 100 µm, and a length of 11 mm. It is sealed on the top with a tiny glass window with a thickness of 145 µm.
-
Figure 1
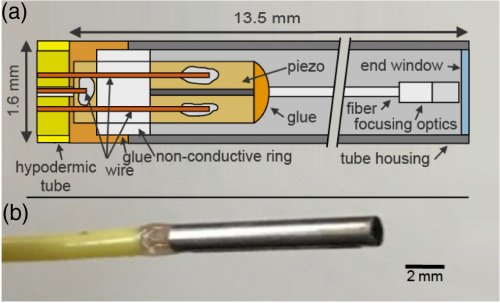
(a) Schematic drawing of the piezo fiber scanning probe (not to scale). (b) Image of the fiber scanning endoscope (FSE).
The customized piezo tube (Pi Ceramic, Lederhose, Germany) was made from a lead zirconate titanate ceramic with an inner diameter of 500 μm, an OD of 800 μm, and a length of 4.5 mm. On the outer circumference, a four-fold segmented electrode was attached. For a better accessibility, the joint electrode on the inner surface of the tube was guided from the inside to the outside forming a fifth electrode. The electrodes were connected by soldering 100 μm copper wires by hand and covering them by a thin layer of epoxy. The piezo tube was fixed with a non-conductive ring of polymethyl methacrylate with an OD of 1.4 mm centered in the stainless steel tube. To position the fiber centrally in the piezo, a drop of epoxy with a diameter equal to the inner diameter of the piezo was glued to the upper attachment point of the fiber. Then the fiber was glued with a UV-curing adhesive to the piezo tube after it was adjusted via a five degree-of-freedom platform where the epoxy drop was used as a fulcrum. A hypodermic tube was glued to the piezo and the stainless steel tube. This results in a measured rigid length of 13.5 mm. In contrast to previous designs, in our approach the optics is part of the oscillating system. The focusing optics was made of a combination of different fibers which were assembled by fusion splicing [Fig. 2(a)]. For the 1300 nm central wavelength of the OCT system, a SMF-28 (Thorlabs, Newton, New Jersey, U.S.) single-mode fiber was used for the light delivery. Focusing was optimized to obtain a focus size with a full width at half-maximum (FWHM) of about 12 µm at a working distance of 1.5 mm in air by simulation of the beam propagation[20], which was implemented in MATLAB (R2016a, Mathworks, Natick, Massachusetts, U.S.). A glass spacer was used to enlarge the beam (1/e2) to half the GRIN fiber core diameter of about 100 µm.
-
Figure 2
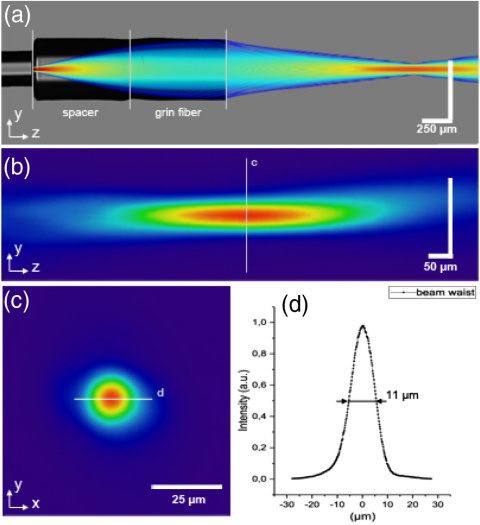
(a) All-fiber-based focusing optics, overlaid with simulated beam intensity. (b) Measured beam profile in the focus along the z-axis, (c) measured lateral beam profile (x,y) in the focus, and (d) the measured lateral beam profile across the line in.
The spacer was made from a step index multi-mode fiber (FG200LEA, Thorlabs, Newton, New Jersey, U.S.) spliced to the single-mode fiber and precisely cleaved at a length of 750 μm with the Glass Processor GPX 3800 (Thorlabs, Newton, New Jersey, U.S.). The enlarged beam was then focused by a 750 µm long piece of 0.22 NA GRIN fiber (Fiberware, Berlin, Germany) fused to the spacer. To reduce reflection, the end face was 4° angle polished using a bare fiber polisher (Trig Bare Fiber Polisher, Krelltech, Neptune City, New Jersey, U.S.). A return loss of better than -55 dB was achieved. The spliced optics overlaid with the simulation of the beam propagation is shown in Fig. 2(a).
The length of the fiber segment outside the piezo determines the scanning frequency. In order to take into account the changed fiber diameter and the additional masses at the distal end, the resonance frequency was calculated by a finite element analysis (COMSOL Multiphysics, Burlington, Massachusetts, U.S.). The aimed resonance frequency of about 1.2 kHz resulted in a cantilever length of 8 mm. However, a slight inclination of the fiber relative to the imaginary axis due to the manufacturing process leads to a lateral shift of the center of mass. As a result, the two oscillation axes are no longer orthogonal to each other and have a different resonance frequency. A spiral oscillation of the fiber is generally induced by driving the electrodes on the opposite side with opposite polarity. The voltage of adjacent electrodes has to be shifted by 90° to excite a circular movement[21]. In order to obtain a clean spiral scan, despite the manufacturing tolerances, the control parameters have to be adjusted which, in our case, was done by manual optimization. Therefore, the voltage amplitude for both channels was set to 40 volts; then the frequency was determined, at which the greatest possible amplitude was reached for both channels. Afterwards, the parameters voltage, frequency, and phase shift were changed incrementally to achieve the largest possible symmetrical field of view (FOV). The excitation was applied at a frequency of 1223.6 kHz with a maximum amplitude of 38.7 V for one axis and 46.1 V for the other axis at a phase shift of 80 deg. One full spiral contains 120 oscillation periods. The time for the upswing of the spiral was 95 ms. Imaging was done only during the upswing. After reaching the full amplitude, the phase of the control signal was changed by approximately 180° to invert the voltages. The required parameters were also determined by manual optimization. This eliminated the vibrations within 30 ms and reduced the dead time by a factor of approximately 10 which could not be used for imaging. The driving signals are generated by LabVIEW (Spring 2017, National Instruments, Austin, Texas, U.S.) and a DAQ board (USB-6343, National Instruments, Austin, Texas, U.S.) connected to high voltage amplifiers (E385 Dura Act, Physik Instruments, Lederhose, Germany).
The optical properties of the OCT probe were characterized by measuring the beam profile of the focus [Fig. 2(b)]. The probe was placed in front of a beam profiling camera (SP300, Ophir-Spircon Europe GmbH, Darmstadt, Germany) which was mounted on a motorized translational stage. Measurements were done in a range of 500 μm around the focal plane.
At the beam profile [Fig. 2(b)], no significant interference effects could be observed. As predicted by the optical simulations, the measured diameter (FWHM) at the focal point, which was situated 1.25 mm in front of the probe, was 11 µm [Figs. 2(c) and 2(d)]. Based on this, the calculated numerical aperture is 0.044. To avoid undersampling, the pixel spacing, even of the outermost circle, has to satisfy the Nyquist criterion. The maximum detectable spatial frequency depends on the NA of the optics and the center wavelength λ = 1300 nm. In the confocal case, the minimum sampling distance is given by[22]
-
Equation 1
[ Delta x_{min} /approx /frac{lambda}{8NA}=3.7 mu m ]
Assuming the probe reaches a maximum image FOV of d=0.8 mm and a resonance frequency of f= 1.2 kHz, the minimum required A-scan rate for sufficient sampling is given by
-
Equation 2

Here, we used a self-built OCT system employing a 3.28 MHz FDML laser[23]. Light from the FDML source was coupled into a fiber-based beam splitter and then guided into the reference and the sample arm which is connected to the probe.
The reference arm consisted of a path length compensation fiber, a collimating lens, and a lens mirror combination. Interference was measured by a 1.6 GHz balanced detector (PDB480C-AC, Thorlabs, Newton, New Jersey, U.S.), which was connected to a 4 GS/s digitizing board (CobraMax Express CompuScope, DynamicSignals LLC, Lockport, Illinois, U.S.). During processing of the OCT images, the dispersion mismatch between both arms was corrected numerically with a second-order polynomial. With a spectral bandwidth of 120 nm at a center wavelength of 1292 nm, an axial resolution of 7.5 μm in air was achieved. The acquisition of each volume was triggered by the start of each spiral scan. During acquisition, the data were streamed to the hard disk. For the reconstruction of the imaged volumes, which was done in the post-processing, it is necessary to know the position of the spot during the spiral scan. Since a small variation in the alignment has a significant impact on the scan pattern, a look-up table [Fig. 3(a)] was generated before the measurement using a position sensitive detector (PDP90A, Thorlabs, Newton, New Jersey, U.S.), which was placed in the focal plane of the probe. Measurement of the look-up table was performed once a day. The reconstructed image was 512×512 pixels in lateral direction and 600 pixels in axial direction.
-
Figure 3
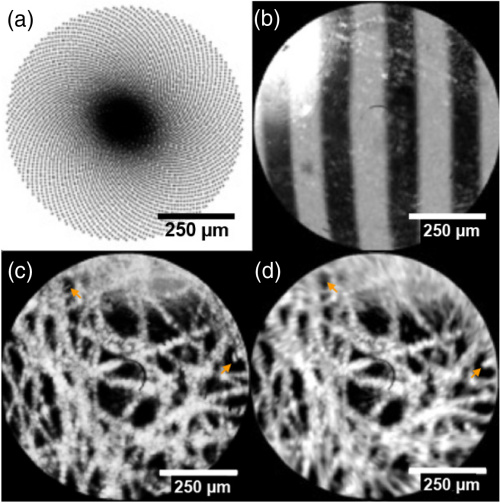
(a) Look-up table for assigning the measured A-scans to their correct spatial location. (b) En face image calculated from a maximum intensity projection of an image of a line pattern. (c) En face image of lens tissue sampled at 3.28 MHz A-scan rate. (d) Simulated en face image with numerically reduced A-scan rate of 100 kHz. Blurring can be observed at the outer part of the FOV (arrow). -
Visualization 1
To demonstrate that the oscillations of the fiber were stable enough to reconstruct a distortion-free image, a line target with alternating reflective and scattering strips of 100 μm width each was imaged. Figure 3(b) shows the en face reconstruction of the imaged volume by a maximum intensity projection (MIP). Using the line target, the image field was measured to be approximately 800 μm in diameter. This is 50% of the OD of the probe (1.6 mm). Due to the moving focusing optics, an optimal resolution is achieved over the entire FOV. However, some artifacts can also be seen in the pictures. Due to timing problems during the streaming of the OCT data, missing pixels appeared as black stripes in the image. In addition, a part of the image field is blurred by a reflection, which is caused by adhesive residues on the end window.
To visualize the effect of the A-scan rate on the image quality, lens tissue was imaged [Fig. 3(c) and Visualization 1]. At 3.28 MHz, a constantly good image quality was achieved over the full FOV. By numerically simulating a reduced A-scan rate of 100 kHz [Fig. 3(d)], image artifacts were demonstrated which would occur when the imaging speed of current clinical devices would be used. In this case, the Nyquist criterion is no longer met, and the outer ring of the image is eight-fold undersampled. The image quality stays optimal in the central area, but a clear deterioration is visible at the edge. In vivo measurements were done with volunteers on the skin of the fingertip. The finger was held freely in front of the endoscopic probe. A rendered 3D volume is shown in Fig. 4. Due to the high-volume rate and the short recording time of less than 100 ms per volume, continuous recordings of movement were possible without visible inner-volumetric distortions (see Visualization 1). Due to the dense sampling and the good image quality, fine structures such as the sweat glands are visible, even at the edges of the FOV [Fig. 4(b)].
-
Figure 4.
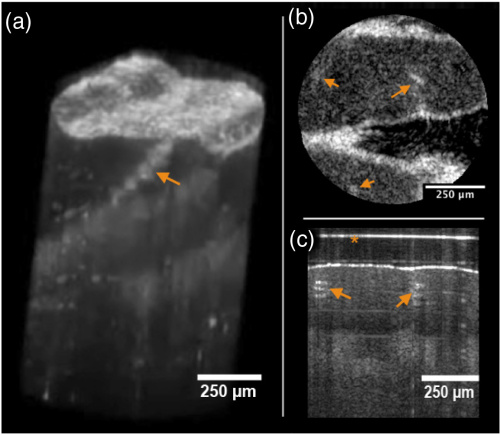
(a) Volume displayed as MIP, (b) an extracted en face plane, and (c) an extracted B-scan from of a measured fingertip. The papillary strips and underlying structures such as the sweat glands (arrow) are visible. The (*) indicates the surface of the end window of the probe -
Visualization 2.
In contrast to the previous work[10,16-18], the probe can be inserted into the working channel of thin endoscopes. It was successfully tested on a 6 mm flexible fiber endoscope (Richard Wolf GmbH, Knittlingen, Germany) with a working channel diameter of 2.2 mm. The OD of the new probe of only 1.6 mm and the rigid length of 13.5 mm are smaller than previously reported. An A-scan rate of 3.28 MHz avoids undersampling at the edges of the FOV despite the high-volume rates of 6 volumes per second. The improvements achieved over previously demonstrated systems[17,18] are crucial for real-time imaging in a clinical setting, giving the advantage of a better registration, orientation, and navigation. This achievement is based on a new all-fiber-based optics which uses the GRIN fiber with a large diameter for focusing and the high-speed OCT system. Previous problems with inherent reflections at the fiber end or the surface of a focusing optics could be avoided. An additional advantage is the uniform image quality over the entire FOV. Additionally, assembly and alignment of the probe become greatly simplified by the all-fiber-based approach. Focusing properties of the fiber probe can easily be adjusted by changing the length of the spacer and the GRIN fiber. Using different types of fibers, the resolution can be varied from 4.5 to 40 µm, while the working distance changes from 0 to 3000 µm.
In summary, we demonstrated a new design for a forward-viewing fiber-scanning OCT probe with reduced OD and rigid length. An image field of 800 µm, a working distance of 1.2 mm, and a lateral resolution of 11 μm were achieved. By using a 3.28 MHz FDML-based OCT system, densely sampled volumes were imaged at a rate of 6 Hz. The high A-scan rate of the FDML-OCT gives room to speed up the volume rate by shortening the fiber or to increase the lateral resolution. In the future, the FSE will be further developed to visualize and quantify mucus transport in the respiratory tract in clinical trials.
Funding
German Center for Lung Research (DZL), Bundesministerium für Bildung und Forschung (BMBF 82DZL001A2); Neuro-OCT, Bundesministerium für Bildung und Forschung (BMBF) (BMBF 13GW0227B); European Union Project ENCOMOLE-2i (ERC CoG 646669, Horizon 2020); Deutsche Forschungsgemeinschaft (DFG) (DFG EXC 306/2, HU 629/5-2, HU1006/6); CellTom, CellTom part-financed by Interreg Deutschland-Danmark with means from the European Regional Development Fund (ERDF).
References
- D. Huang, E. A. Swanson, C. P. Lin, J. S. Schuman, W. G. Stinson, W. Chang, M. R. Hee, T. Flotte, K. Gregory, and C. A. Puliafito, Science 254, 1178 (1991).
- G. J. Tearney, M. E. Brezinski, B. E. Bouma, S. A. Boppart, C. Pitris, J. F. Southern, and J. G. Fujimoto, Science 276, 2037 (1997).
- G. J. Tearney, M. E. Brezinski, S. A. Boppart, B. E. Bouma, N. Weissman, J. F. Southern, E. A. Swanson, and J. G. Fujimoto, Circulation 94, 3013 (1996).
- M. J. Gora, M. J. Suter, G. J. Tearney, and X. Li, Biomed. Opt. Express 8, 2405 (2017).
- H. S. Cho, S.-J. Jang, K. Kim, A. V. Dan-Chin-Yu, M. Shishkov, B. E. Bouma, and W.-Y. Oh, Biomed. Opt. Express 5, 223 (2014).
- T. Wang, T. Pfeiffer, E. Regar, W. Wieser, H. van Beusekom, C. T. Lancee, G. Springeling, I. Krabbendam, A. F. W. van der Steen, R. Huber, and G. van Soest, Biomed. Opt. Express 6, 5021 (2015).
- K. Liang, Z. Wang, O. O. Ahsen, H.-C. Lee, B. M. Potsaid, V. Jayaraman, A. Cable, H. Mashimo, X. Li, and J. G. Fujimoto, Optica 5, 36 (2018).
- B. Y. Yeo, R. A. McLaughlin, R. W. Kirk, and D. D. Sampson, Biomed. Opt. Express 3, 1565 (2012).
- M. Villiger, D. Lorenser, R. A. McLaughlin, B. C. Quirk, R. W. Kirk, B. E. Bouma, and D. D. Sampson, Sci. Rep. 6, 28771 (2016).
- T. Xie, H. Xie, G. K. Fedder, and Y. Pan, Electron. Lett. 39, 1535 (2003).
- Y.-H. Seo, K. Hwang, and K.-H. Jeong, Opt. Express 26, 4780 (2018).
- E. J. Seibel, Q. Y. J. Smithwick, J. L. Crossman-Bosworth, and J. A. Myers, Proc. SPIE 4616, 173 (2002).
- M. T. Myaing, D. J. MacDonald, and X. Li, Opt. Lett. 31, 1076 (2006).
- X. Liu, M. J. Cobb, Y. Chen, M. B. Kimmey, and X. Li, Opt. Lett. 29, 1763 (2004).
- L. Huo, J. Xi, Y. Wu, and X. Li, Opt. Express 18, 14375 (2010).
- S. Vilches, S. Kretschmer, C. Ataman, and H. Zappe, J. Micromech. Microeng. 27, 105015 (2017).
- K. L. Lurie, A. A. Gurjarpadhye, E. J. Seibel, and A. K. Ellerbee, Opt. Lett. 40, 3165 (2015).
- K. Liang, O. O. Ahsen, Z. Wang, H.-C. Lee, W. Liang, B. M. Potsaid, T.-H. Tsai, M. G. Giacomelli, V. Jayaraman, H. Mashimo, X. Li, and J. G. Fujimoto, Opt. Lett. 42, 3193 (2017).
- R. Huber, M. Wojtkowski, and J. G. Fujimoto, Opt. Express 14, 3225 (2006).
- D. Lorenser, X. Yang, and D. D. Sampson, IEEE Photonics J. 5, 3900015 (2013).
- C. J. Engelbrecht, R. S. Johnston, E. J. Seibel, and F. Helmchen, Opt. Express 16, 5556 (2008).
- T. Wilson, J. Microsc. 244, 113 (2011)
- T. Pfeiffer, W. Draxinger, W. Wieser, T. Klein, M. Pettermann, and R. Huber, Proc. SPIE 10053, 10053 (2017).
© 2018 Optical Society of America. Users may use, reuse, and build upon the article, or use the article for text or data mining, so long as such uses are for non-commercial purposes and appropriate attribution is maintained. All other rights are reserved
BibTeX (Download)
@article{Schulz-Hildebrandt2018b,
title = {High-speed fiber scanning endoscope for volumetric multi-megahertz optical coherence tomography},
author = {Hinnerk Schulz-Hildebrandt and Tom Pfeiffer and Tim Eixmann and Sabrina Lohmann and Martin Ahrens and Josua Rehra and Wolfgang Draxinger and Peter K\"{o}nig and Robert Huber and Gereon H\"{u}ttmann},
url = {https://www.osapublishing.org/ol/abstract.cfm?uri=ol-43-18-4386#Abstract},
doi = {10.1364/OL.43.004386},
year  = {2018},
date = {2018-09-05},
journal = {Optics Letters},
volume = {43},
number = {18},
pages = {4386-4389},
abstract = {We present a forward-viewing fiber scanning endoscope (FSE) for high-speed volumetric optical coherence tomography (OCT). The reduction in size of the probe was achieved by substituting the focusing optics by an all-fiber-based imaging system which consists of a combination of scanning single-mode fibers, a glass spacer, made from a step-index multi-mode fiber, and a gradient-index fiber. A lateral resolution of 11 μm was achieved at a working distance of 1.2 mm. The newly designed piezo-based FSE has an outer diameter of 1.6 mm and a rigid length of 13.5 mm. By moving the whole imaging optic in spirals for scanning the sample, the beam quality remains constant over the entire field of view with a diameter of 0.8 mm. The scanning frequency was adjusted to 1.22 kHz for use with a 3.28 MHz Fourier domain mode locked OCT system. Densely sampled volumes have been imaged at a rate of 6 volumes per second.

© 2018 Optical Society of America},
keywords = {Endoscopic imaging., fiber probes, Optical coherence tomography},
pubstate = {published},
tppubtype = {article}
}